

Quick Answer: What formulas go into an HR MIS report?
An HR MIS report consolidates workforce data – headcount, attrition, payroll cost, compliance status – into a format built for decision-making, not just record-keeping. The core calculations most HR MIS reports need:
- Attrition Rate = (Employees Exited ÷ Average Headcount) × 100
- Headcount Growth = (Closing – Opening Headcount) ÷ Opening Headcount × 100
- Payroll Cost Variance = (Actual – Budgeted Payroll) ÷ Budgeted Payroll × 100
- Cost Per Hire = Total Recruitment Cost ÷ Number of Hires
- Absenteeism Rate = Absent Days ÷ (Working Days × Avg Headcount) × 100
- Compliance Filing Ratio = Filings Completed On Time ÷ Total Filings Due × 100
An MIS report, at its core, is a structured document that summarises business data to help managers monitor performance and support decision-making. What makes it different from a dashboard or a quick data pull is that it consolidates information into one analytical view, built to hold up when someone actually needs to act on it, not just glance at it. For HR specifically, this means headcount, attrition, payroll cost, leave utilization, and – for Indian businesses -statutory compliance status, all in one place.
What Actually Goes Into an HR MIS Report
A well-built MIS report has a consistent structure, regardless of which department it covers. It opens with an executive summary – the two or three numbers leadership actually needs before reading further. This is followed by the data section, where the underlying figures live, organized in a way that supports the summary rather than burying it. Most reports then include a visual or pivot section – charts, trend lines, or pivot tables that make patterns visible rather than requiring someone to read every row. Finally, an appendix holds the detailed, granular data for anyone who needs to drill down.
Sample MIS Report Format
Seeing an actual format makes this concrete faster than any description. Here’s what a basic monthly HR MIS report table typically looks like:
| Metric | This Month | Last Month | Variance | Target |
| Headcount | 142 | 138 | +4 | 150 |
| Attrition Rate | 3.2% | 2.8% | +0.4% | <3% |
| Payroll Cost | ₹48.6L | ₹46.2L | +5.2% | ₹47L |
| Open Positions | 8 | 11 | -3 | – |
| Avg. Time to Hire | 22 days | 26 days | -4 days | 20 days |
| Compliance Filings Due | 3 | 2 | +1 | 0 overdue |
A financial MIS report follows the same logic with different rows – revenue, expenses, budget utilization, cash position – and a sales MIS report would swap in pipeline value, conversion rate, and deals closed.
HR MIS Report Excel Formulas
This is the part most MIS guides skip – they’ll tell you to “use PivotTables” without ever showing you the formula that goes into the report itself. One caveat before you use these: the cell references below (like D2, E2) are illustrative, matching a specific example layout – they won’t work by pasting them exactly as written unless your columns happen to line up the same way. Find whichever column in your own sheet holds each value, and adjust the letter and row accordingly. What matters is the logic of the formula, not the exact cell address.
Attrition Rate: the single most-tracked HR MIS metric: =(Employees Exited During Period / Average Headcount for Period) * 100 If exits are in your “Exits” column and average headcount is in your “Avg Headcount” column, for row 2 that’s =D2/E2*100 – but only if D and E are actually where those two numbers live on your sheet. Average headcount itself is =(Opening Headcount + Closing Headcount)/2.
Headcount Growth Rate: =((Closing Headcount – Opening Headcount) / Opening Headcount) * 100 Same logic applied to whichever columns hold your opening and closing headcount: =(C2-B2)/B2*100.
Payroll Cost Variance: flags whether payroll spend is drifting from budget: =((Actual Payroll Cost – Budgeted Payroll Cost) / Budgeted Payroll Cost) * 100 Applied to your actual and budgeted payroll columns: =(F2-G2)/G2*100.
Cost Per Hire: =Total Recruitment Cost / Number of Hires in Period Applied to your cost and hires columns: =H2/I2.
Absenteeism Rate: =(Total Absent Days / (Total Working Days * Average Headcount)) * 100 Applied to your absence, working days, and headcount columns: =J2/(K2*E2)*100.
Compliance Filing Ratio – useful for statutory MIS tracking: =(Filings Completed On Time / Total Filings Due) * 100 Applied to your filings columns: =L2/M2*100.
For the conditional formatting layer, the rule that actually matters is setting a threshold-based color scale on your variance columns – for instance, on attrition rate, a common rule is green under 2%, yellow between 2-4%, red above 4%, set via Home → Conditional Formatting → Color Scales, then customized with Manage Rules to match your organization’s actual thresholds rather than Excel’s defaults.
For sparklines specifically tracking trend direction, select your monthly data range, go to Insert → Sparklines → Line, and anchor the output cell right next to the metric it’s tracking, not in a separate section – the whole value of a sparkline is sitting inline with the number it explains.
Tracking PF, ESI, and PT Deadlines Directly in Excel
This is the piece that connects the compliance point above to something you can actually build. Most HR teams track statutory due dates in a separate calendar or reminder app, disconnected from the MIS report itself – which means the report shows compliance status as of the last update, not as of today.
A simple fix is a due-date column with a formula that flags status automatically, using TODAY() against your filing deadline column. If your due date is in column N, a formula like: =IF(N2<TODAY(),”OVERDUE”,IF(N2-TODAY()<=3,”DUE SOON”,”ON TRACK”)) in the adjacent column gives you a live status label without anyone manually updating it – it recalculates every time the sheet opens, based on today’s actual date. Paired with conditional formatting (red for “OVERDUE”, amber for “DUE SOON”), this turns a static list of dates into something that actually catches your attention before a PF or ESI deadline passes, rather than after.
Dashboard vs. MIS Report – Which One Do You Actually Need
This question comes up often enough that it’s worth addressing directly. A dashboard is built for day-to-day, real-time check-ins – quick visual reads that update continuously and don’t need to be archived. An MIS report is the record that holds up when a board, auditor, or compliance review asks for specifics – a fixed snapshot for a defined period, with the detail to back up every number in it. Most organizations end up needing both, not one or the other.
The dashboard handles daily visibility; the MIS report becomes the periodic, defensible record.
Where Runtime HRMS Fits In
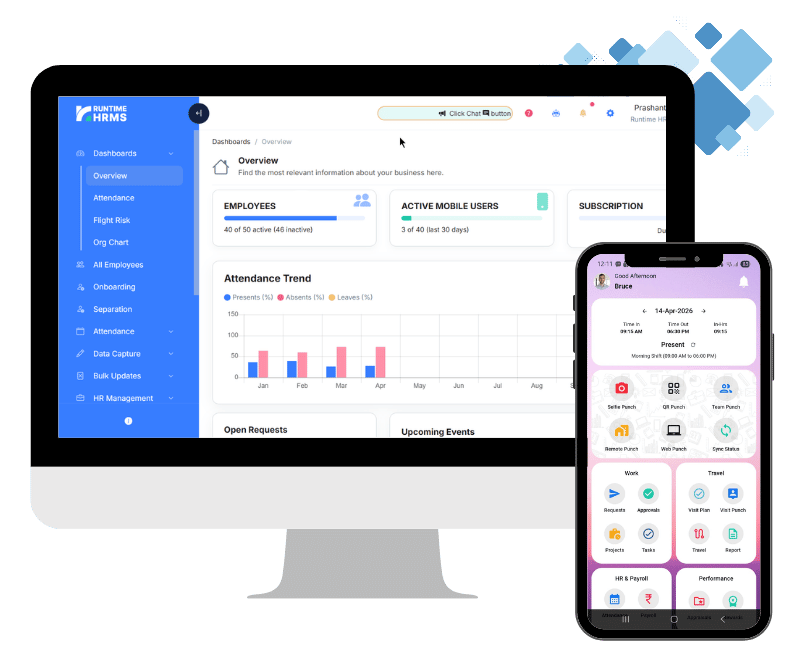
Every formula in this guide – attrition rate, headcount growth, payroll variance, cost per hire, absenteeism, and specifically the Compliance Filing Ratio – is something Runtime HRMS calculates automatically from your live payroll and attendance data, not from a spreadsheet someone has to remember to update. There’s no formula to re-enter each month and no risk of a stale range quietly throwing off your attrition number, and compliance status sits on the dashboard by default, not buried where it only gets noticed after something’s already overdue. Runtime includes 50+ pre-built MIS and compliance reports, with AI-assisted reporting that flags the kind of variance you’d otherwise be setting conditional formatting rules to catch manually.
Read Our Detailed Article: 50+ MIS Reports + AI Reporting in Runtime HRMS
For Excel technical reference: Microsoft Excel